Welcome
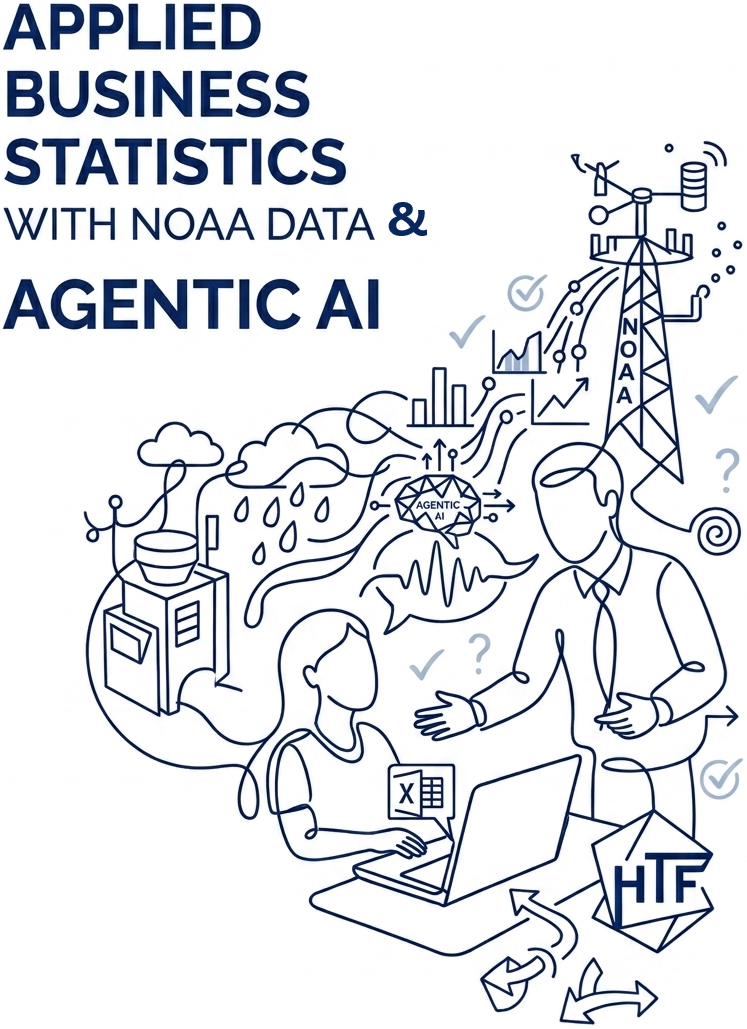
Module development is part of the inaugural cohort of Appalachian State University’s Cloud Analytics Faculty Fellows (CAFF) program, a two-year fellowship funded by a grant from the Appalachian Regional Commission’s ARISE initiative. Industry engagement pairs fellows with analysts from the High Technology Foundation of West Virginia so applied exercises can follow entrepreneurial, practice-oriented data workflows. Cohort programming includes a custom workshop grounded in the Research Institute for Environment, Energy, and Economics (RIEEE) EnviroData Collaborative at Appalachian State. The App State CAFF team supports implementation: Grace Plummer (overall coordination, programming, and support), Michael Erb (data science, NOAA NODD resources, ITS and EnviroData Collaborative liaison), and Erich Schlenker (entrepreneurship, industry connections, and use-case development).
This book supports undergraduate statistics instruction (primarily sophomores and above) through hands-on work with NOAA datasets: real stations, documented variables, and workflows students can repeat and defend. Statistical ideas stay grounded in observable environmental data rather than toy examples alone, using NOAA climate and weather data and NOAA-related resources available through the CAFF program.
The sequence is organized as five modules (thematic units that move from data preparation and descriptive summaries through sampling and simulation, confidence intervals and hypothesis testing, and simple and multiple regression with model diagnostics). Each module is meant to stand as a coherent applied arc while still fitting together into a single progression across the term.
How to use this book
After this welcome page, each numbered chapter is one module. Inside each chapter you will find:
- Learning goals framed around what students should be able to do with NOAA data by the end of that unit.
- A recommended NOAA source (portal links and typical variables) so downloads and variable definitions stay consistent across sections.
- Core statistical ideas spelled out as bullet lists you can map directly to lectures or labs.
- Suggested workflows (step-by-step activities aligned with instructor walkthroughs) and assignment prompts that ask students to replicate or extend those demonstrations with their own station or period (per your syllabus templates).
Together, these pieces are meant to reduce improvisation during lab setup: students know which dataset family they are using, which summaries or models are in scope, and how classroom demos connect to out-of-class work.
Tools referenced in the modules include spreadsheet software (Excel, with optional add-ins where you introduce them), VS Code for text-based cleaning and scripting when appropriate, and course-supported generative AI where you invite students to translate quantitative findings into applied narratives (for example, business or policy framing).
Assessment notes
Across modules, students may use VS Code with GPT-4o-mini to connect weekly quantitative results to a developing business or policy idea, so statistical practice stays linked to communication and decision framing.
Modules may also pair with short readings you assign each unit. Summative checks can include the AI-powered Scalable Online Oral Exam Developed by Dr. Shishir Shakya, administered according to the schedule and rubric in your syllabus.